DC CORE
See server health and investigate performance.
Check server health, review performance history and investigate service availability in Central. Move from a device’s online state to the measurements behind a reported issue.
Investigate a slow server.
Start with the time the problem occurred. Open the server’s telemetry and select a matching time range. Compare available CPU, memory and network readings to see whether the resource pressure coincides with the report.
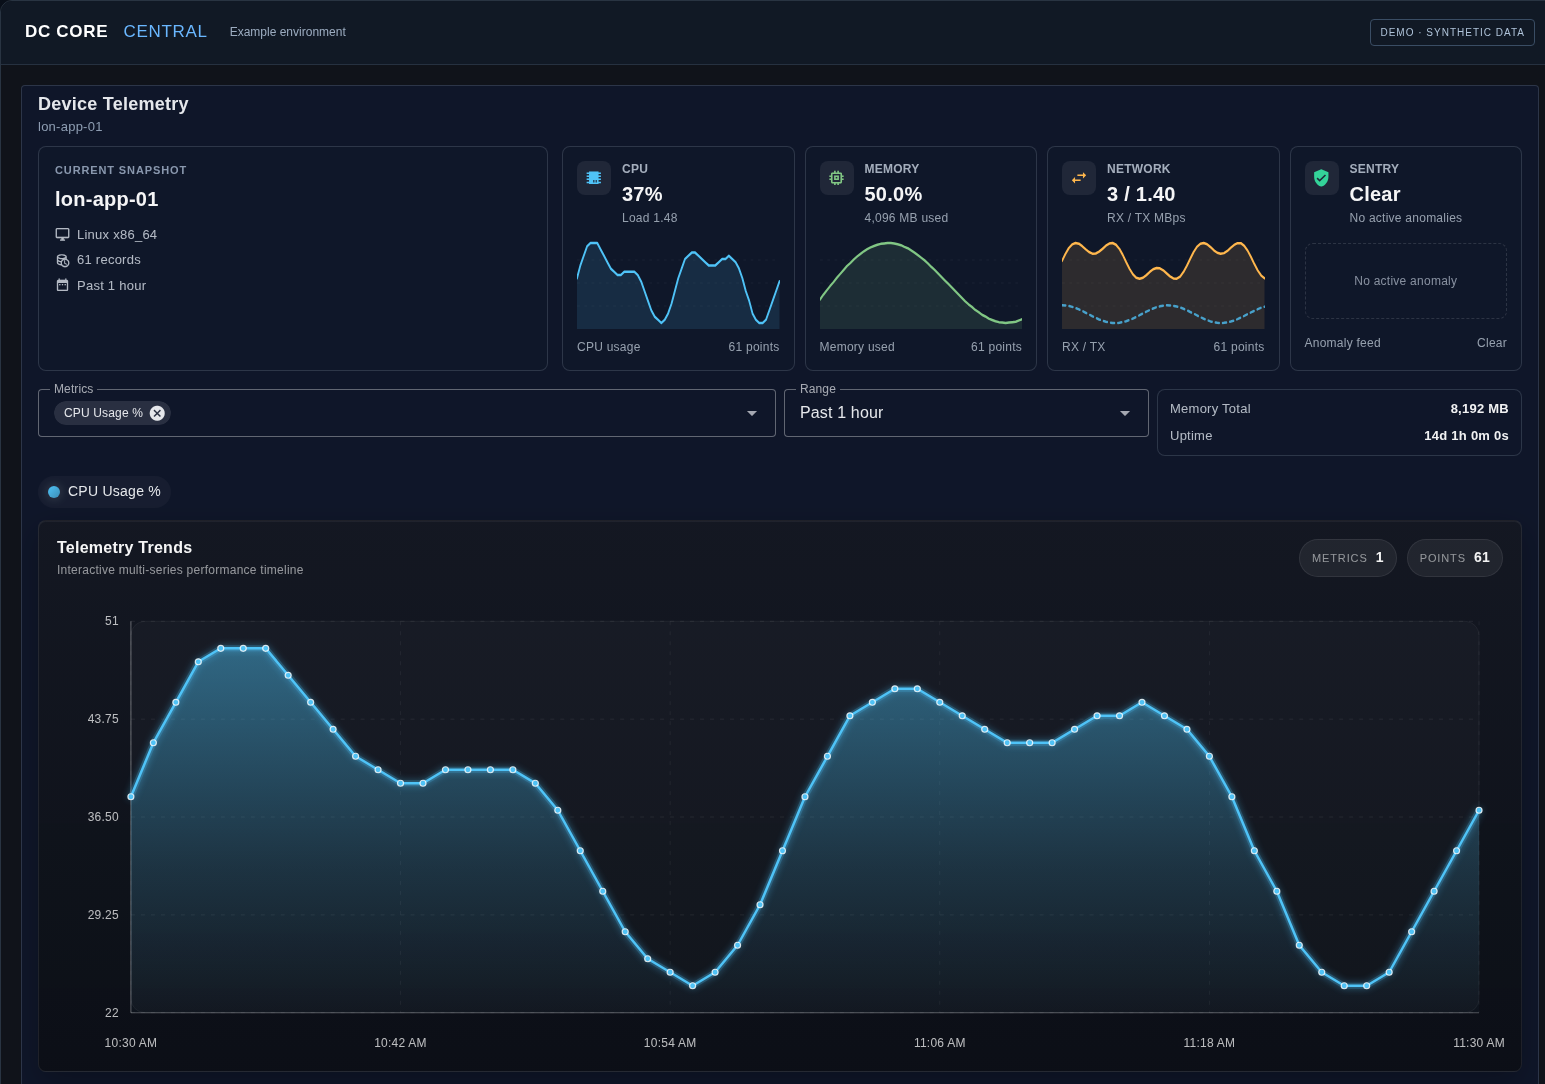
A high reading is a useful lead, not proof of a root cause. Check the affected service and recent operational context before changing the server.
Separate device health from service availability.
| View | What it helps you establish |
|---|---|
| Online state and last report | Whether the agent has recently communicated. A disconnected agent does not by itself prove the server has stopped. |
| Inventory and resource summaries | Which host or VM you are looking at and its available hardware and resource information. |
| Performance history | How the collected CPU, memory or network measurements change during the selected period. |
| HTTP, HTTPS or TCP checks | Whether an applicable service responds. A host can be online while its application is unavailable. |
Readings and actions depend on the deployed agent, configured checks and your permissions. Check supported Windows and Linux platforms.
Decide who follows up.
Your team can use Central to investigate findings and open supported management tools. If you need engineers to monitor and maintain the systems, managed infrastructure adds an agreed operational response.
Central starts at £10/month for five devices, excluding VAT. See pricing and what’s included or follow a server-management workflow.